Detecting Beats in a Supplied Audio File
The Pyrocommander Choreography software enables users select an audio file that they wish to program a show to. Specially designed algorithms analyse the selected audio file and plot the result in a TFFT Graph. This is a Temporal Fast Fourier Transform graph that works by plotting the intensity of the frequency spectrum of the audio across time, and represents intensity through color. The x-axis is used for time (in hh:mm:ss format) and spans the duration of the audio selection. The y-axis is used for frequency (in Hz) and depicts the spectrum of the audio at any one point in time. Then at every point in time and frequency, an intensity calculation is done and a dB figure is calculated (between -128dB and 0dB). This figure is mapped to a color intensity scale and then drawn on the graph.
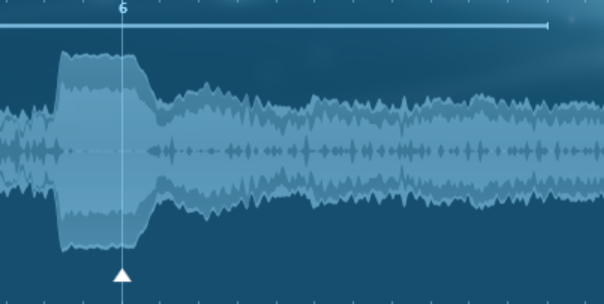
The following figure depicts beat at a higher frequency. Sounds at higher frequencies have ligher colours.
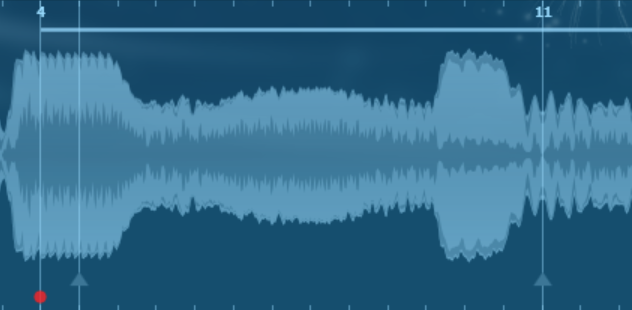
The following figure depicts beat at a lower frequency. Sounds at lower frequencies have darker colours.